

The Conversions and Geography tabs
On this page
Two dashboard tabs cover Block beyond Overview and Invalid traffic: Conversions, on what your traffic costs and brings in, and Geography, on where visitors come from, how they behave and how the monitoring script runs. Open them from the tabs on the Dashboard page (sidebar, Analytics).
Conversions
The tiles
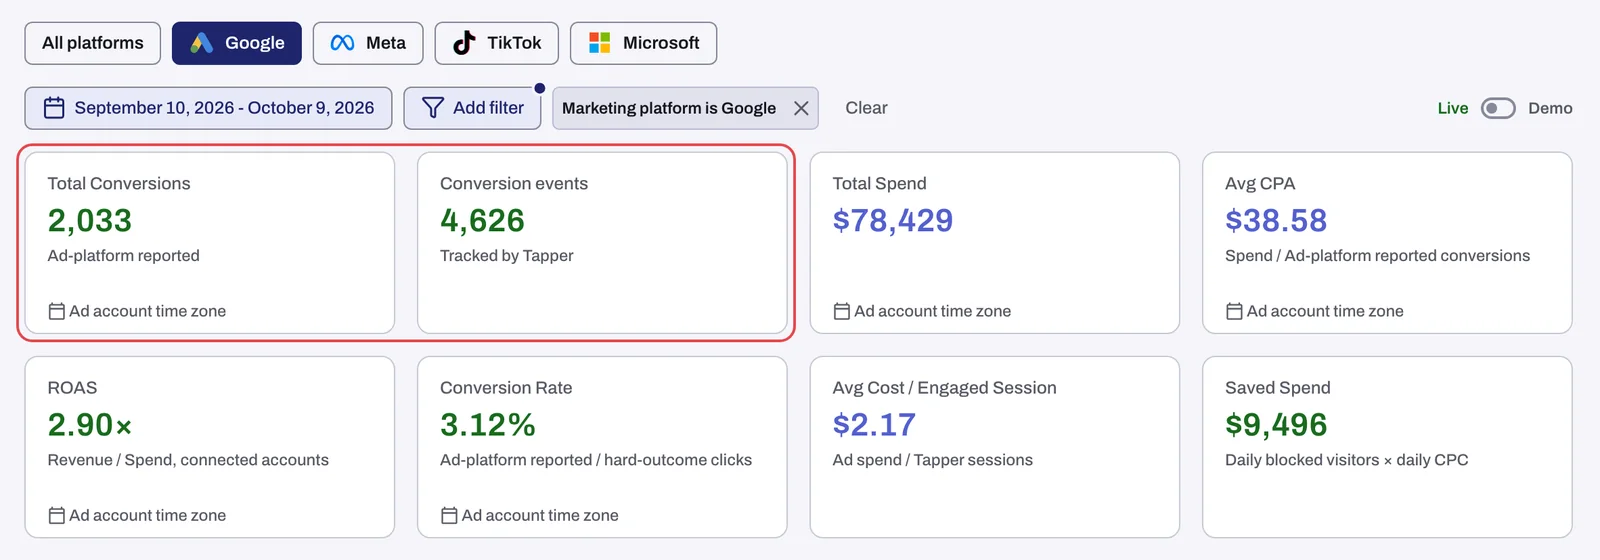
| Tile | What it shows |
|---|---|
| Total Conversions | Conversions as your ad platforms report them. |
| Conversion events | "Tracked by Tapper": the conversions Tapper records on your site through the conversion script or conversion pages. |
| Total Spend | What your connected ad accounts report as spent. |
| Avg CPA | Spend divided by ad-platform conversions. |
| ROAS | Revenue divided by spend on your connected accounts. A dash (-) means no revenue was reported. |
| Conversion Rate | Ad-platform conversions divided by the platform's own clicks. It can go above 100%. |
| Avg Cost / Engaged Session | "Ad spend / Tapper sessions". |
| Reallocated Spend | Tapper's estimate of what the invalid clicks cost, each priced at its own ad account's CPC that day. See Reallocated spend: how your savings are estimated. |
Money on this tab is in US dollars, converted from each ad account's currency at the monthly exchange rate, like the Overview. Each month uses that month's rate, or the closest month's rate when a currency has none for it. An account with no currency on record, or whose currency has no rate at all, is left out of the spend totals and Avg CPC. Its invalid clicks still count in Reallocated Spend, priced at that platform's average cost per click that day from your other accounts, or noted as unpriced when none of them has dollar spend. The spend charts name it, for example Spend (USD) and CPA (USD).
Total Conversions and Conversion events are different counts and are not meant to match. Compare Total Conversions with your ad platform. Conversion events is Tapper's own count, usually higher, and drives the conversion charts by country, device and OS.
The sections
| Section | Cards |
|---|---|
| Conversions | Conversions & conversion rate over time, Conversions by campaign type over time, Conversions by country, Conversions by device type, Conversions by OS |
| Spend & cost | Spend & reallocated spend over time, CPA over time, ROAS over time, Spend by campaign type over time, Avg CPC by campaign type, Cost per engaged session, Spend by ad account |
| Conversion journey | Cross-platform conversion paths (first → last), Keyword by conversion, Visits before conversion, Converted clicks |
| Timing | Conversion rate by day and hour |
The conversion journey
- Cross-platform conversion paths (first → last): for visitors who converted, which platform brought them first and which last.
- Keyword by conversion: your Google Ads keywords ranked by conversions, with Match, Campaign Type, Top Block Reason, Conversions and Blocked Clicks % (Wasted Clicks % on a monitor-only workspace), over its own rolling window, not your dates. Blocked Clicks % is that keyword's blocked clicks divided by all of its clicks in the window, not the account-wide rate.
- Visits before conversion: how many visits came before each conversion.
- Converted clicks: how many ad clicks converting visitors made, Within 10 min, Within 2 days and Within 7 days. It counts converting visitors only and, as its caption says, ignores the date and ad account filters. It shows how often real customers click before they buy, the starting point for an invalid click threshold. See Reading the Invalid traffic tab: reasons, click frequencies and IP types.
Geography
The tiles
| Tile | What it shows |
|---|---|
| Total Clicks | Tapper-tracked clicks, as on the Overview tab. |
| Avg Time on Site | The average time on your site, counted over engaged sessions. |
| Non-Engaged % | The share of sessions that were non-engaged (definition below). |
| Traveling Users | "Seen in 2+ countries · rolling window, not the date filter": the share of visitors Tapper saw in more than one country. |
The sections
| Section | Cards |
|---|---|
| Geography | Clicks by country over time, Top countries by clicks (with a vs top on page column) |
| Devices & browsers | Clicks by OS, Clicks by device type, Traffic by browser |
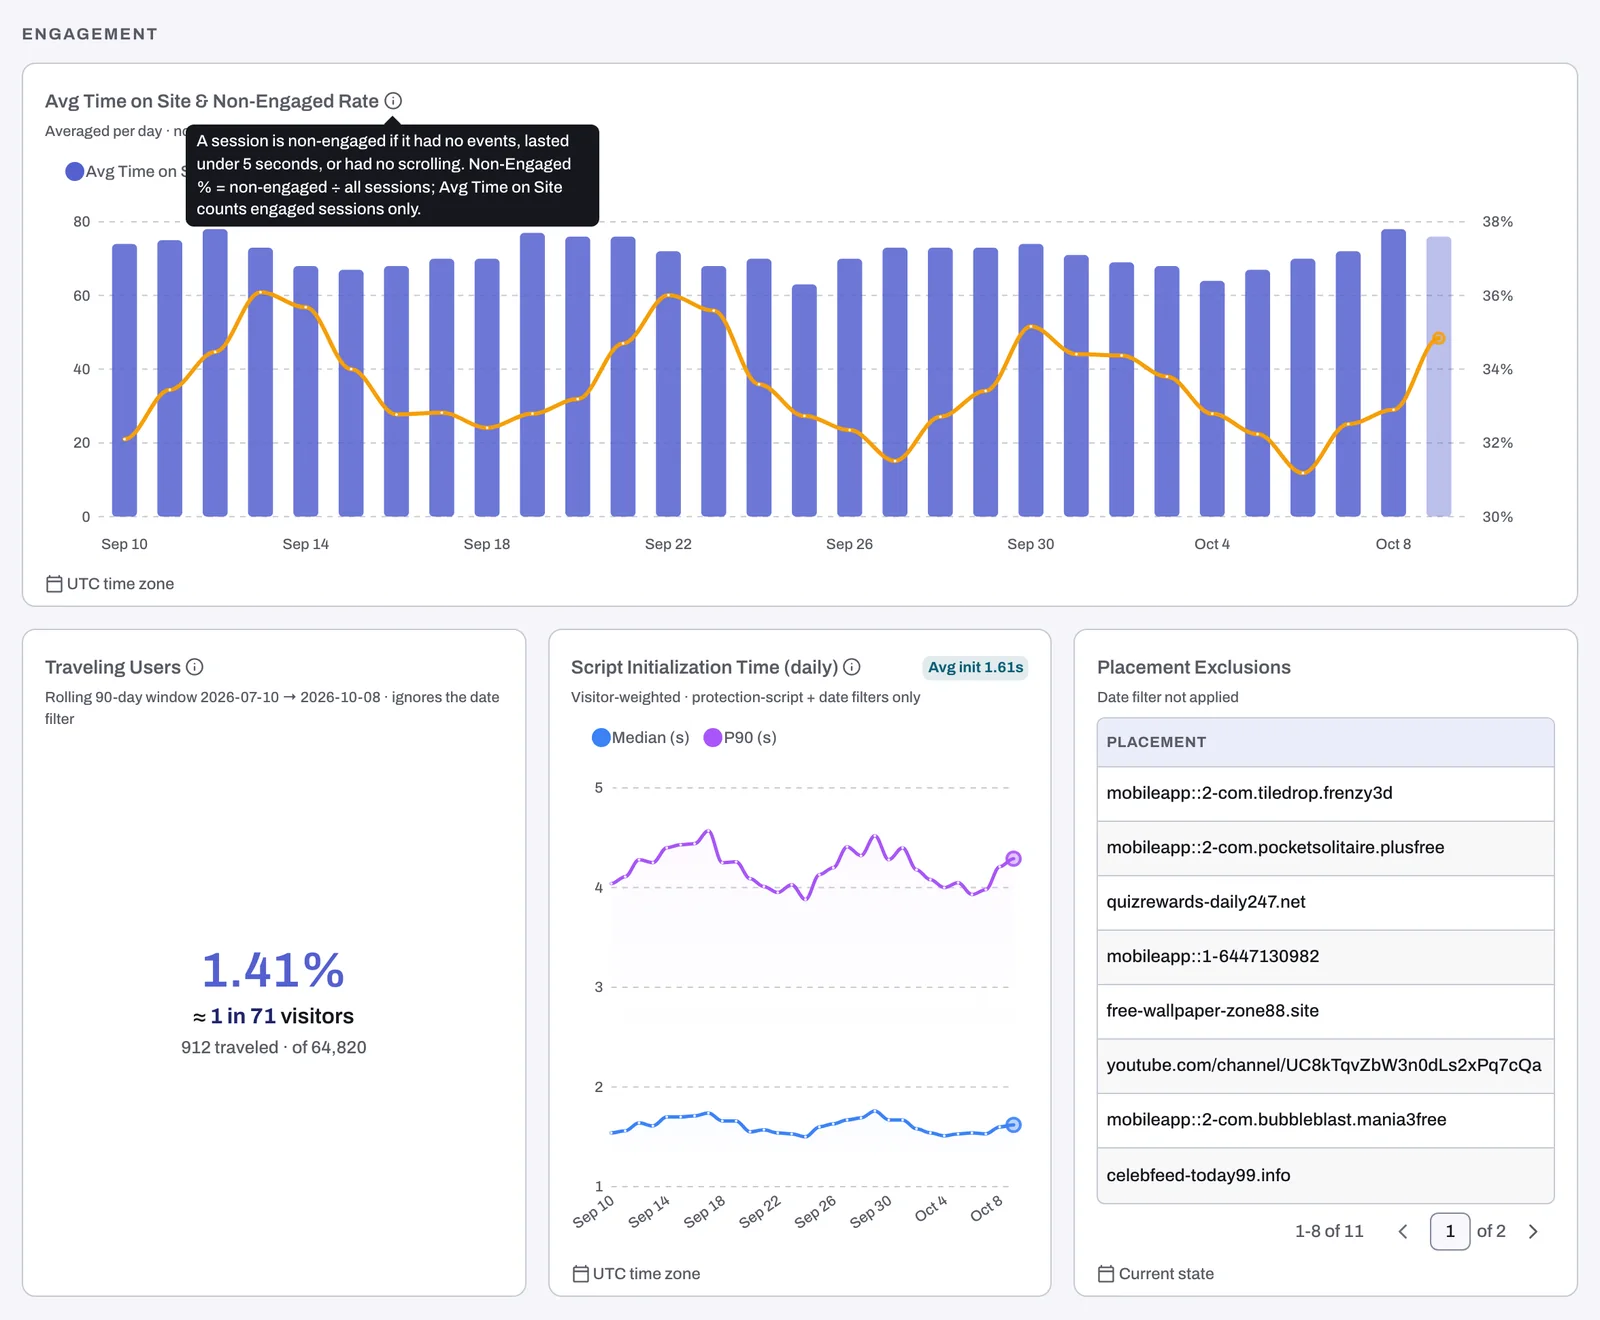
| Engagement | Avg time on site & non-engaged rate, Traveling users, Script initialization time (daily), Placement exclusions |
| Timing | Traffic by day and hour |
The engagement cards
- Avg time on site & non-engaged rate: its "i" tooltip reads "A session is non-engaged if it had no events, lasted under 5 seconds, or had no scrolling." A high non-engaged rate on paid traffic is one sign of clicks that never become real visits.
- Traveling users: visitors seen in two or more countries, over a rolling window that ignores your dates.
- Script initialization time (daily): how long the monitoring script takes to initialize on your pages, by day. See Does the monitoring script slow down my website?
- Placement exclusions: placements Tapper has excluded, with Placement, Platform, Clicks and Score. It ignores your dates. See Placement exclusions on Display and Performance Max.
Heatmaps
On the dashboard, "heatmap" means the day by hour grids of weekdays by hours: Traffic by day and hour on Geography, Conversion rate by day and hour on Conversions and Invalid click rate by day and hour on Invalid traffic. Conversion rate by day and hour uses Tapper's own conversion events across all platforms, so its caption warns it does not match the Conversion Rate tile.
Related
Was this helpful?
Still need help?
Chat with our team and mention this article.