

Monthly reports: what is in your report and how to download it
On this page
After each month closes, Tapper publishes a performance report and keeps earlier months' reports beside it. Read one in the app or download it to share.
Find your reports
In the sidebar, under Analytics, click Reports. The list has one row per month, newest first.
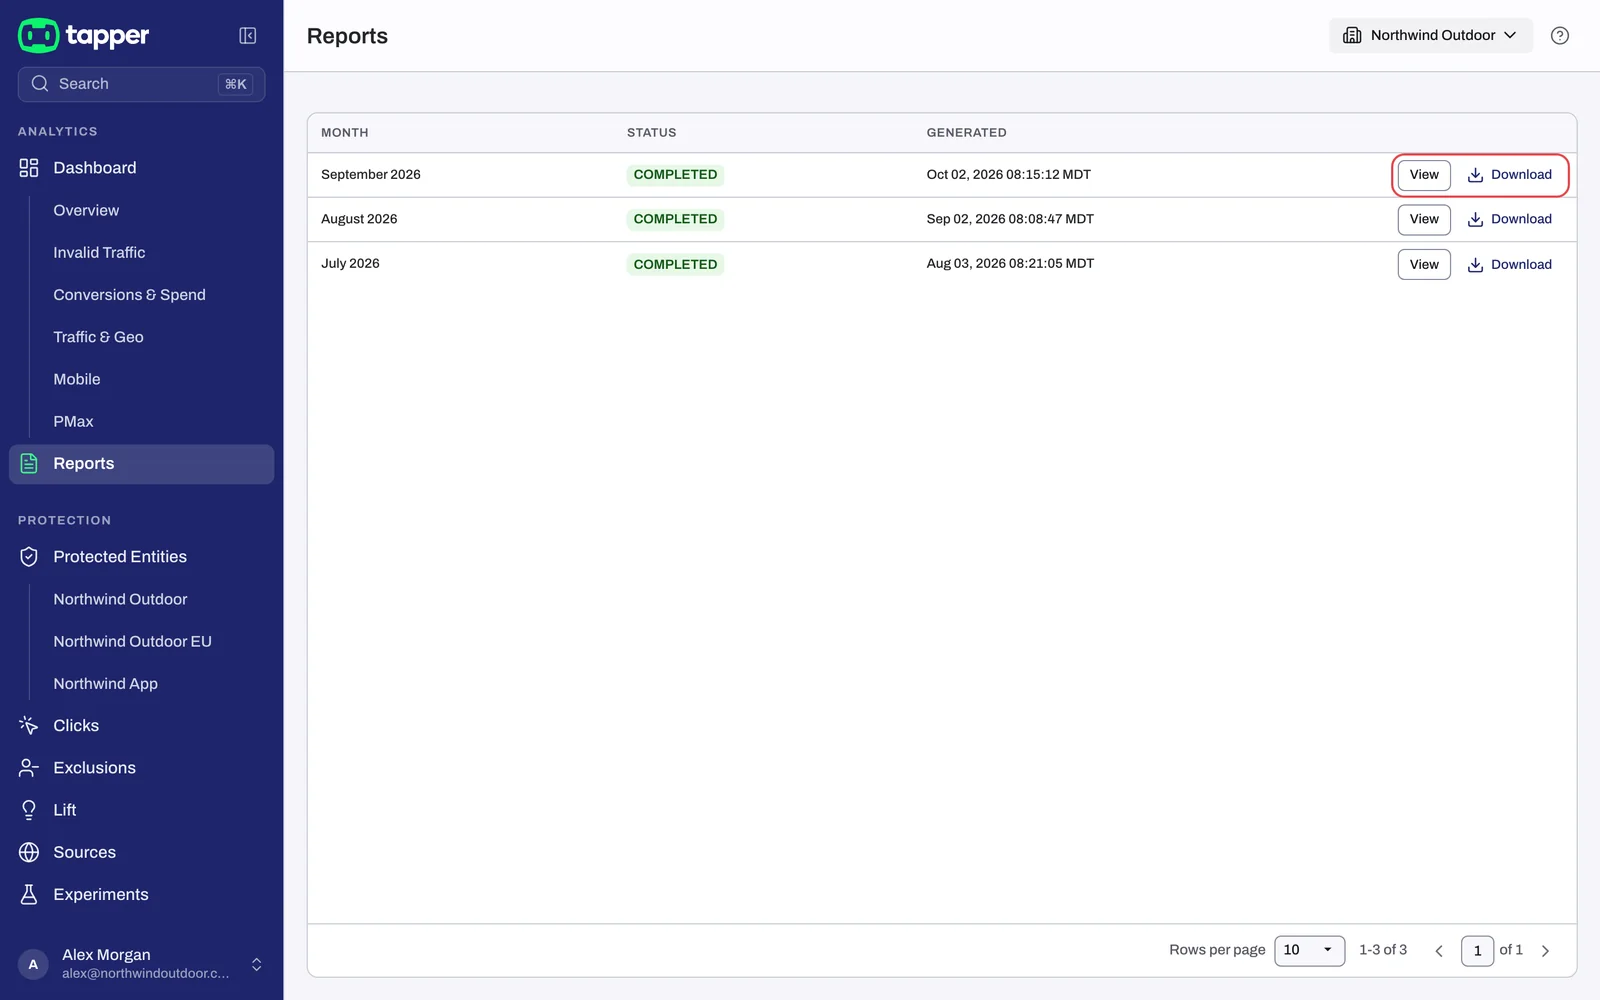
| Column | What it shows |
|---|---|
| Month | The month the report covers, for example "August 2026". |
| Status | The report's state, for example COMPLETED. |
| Generated | When the report was produced. |
Each row has View, to open the report in Tapper, and Download, to save it. With no report yet, the page reads No reports, and View your dashboard takes you to the dashboard.
View or download a report
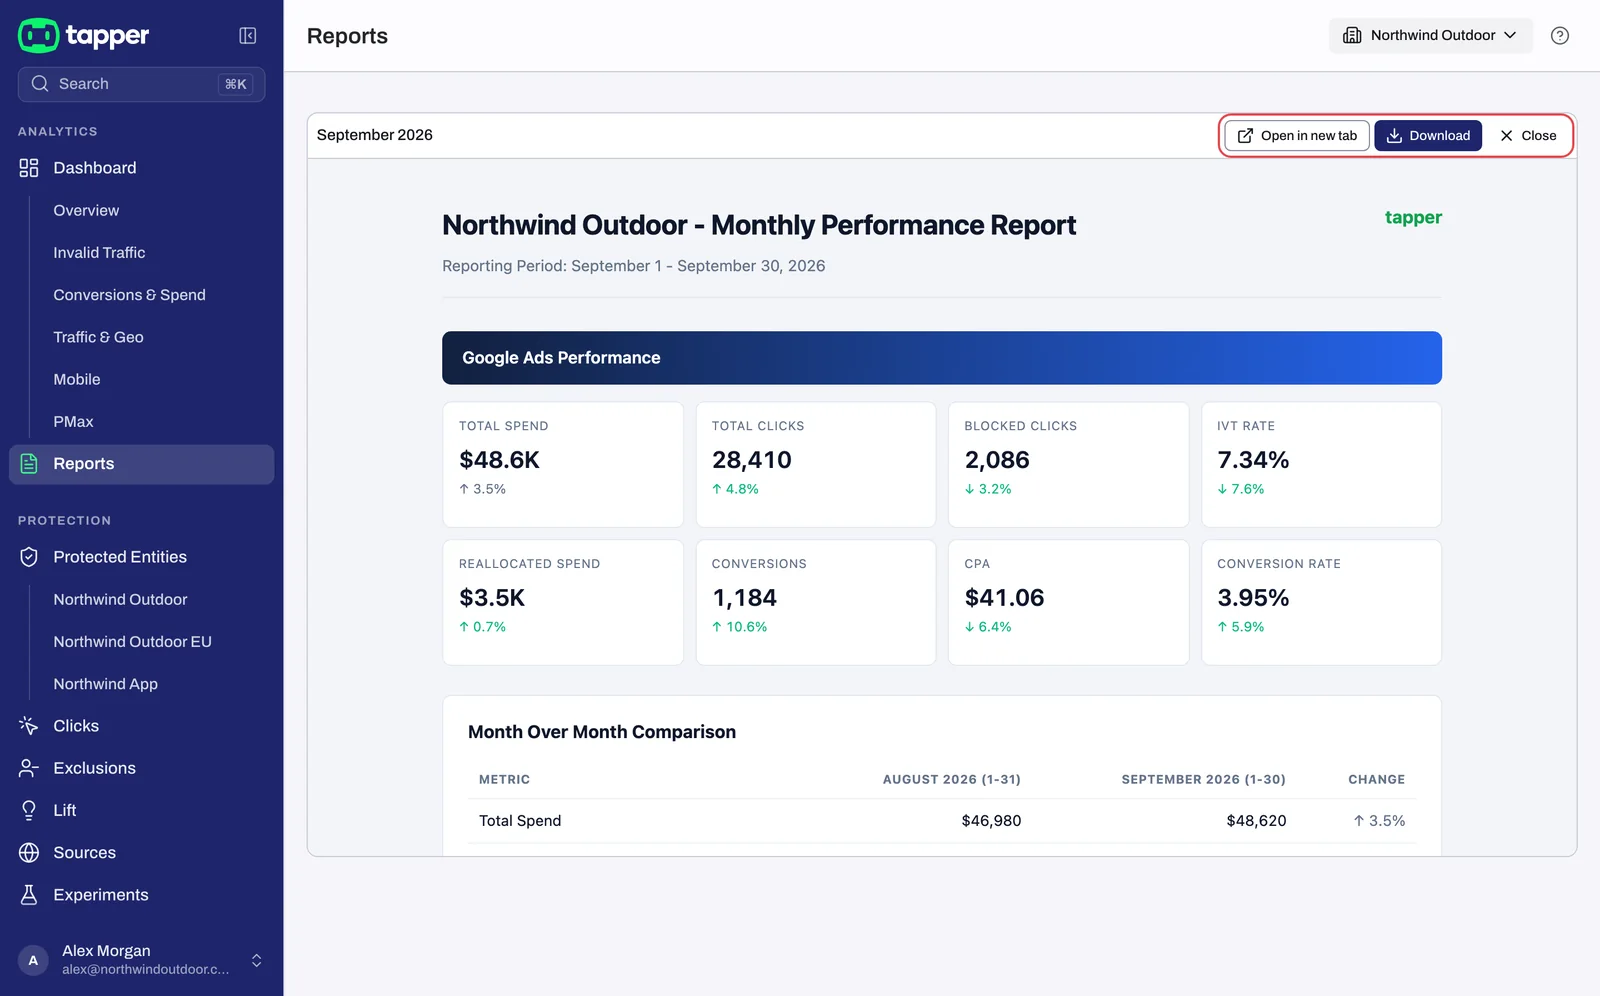
- Click View on the month. The report opens with Open in new tab, Download and Close above it.
- Click Open in new tab for a full browser tab, or Download to save it.
- Click Close to return to the list.
The download is an HTML page. It opens in any browser with its layout intact, ready to attach to an email or share.
Save a report as a PDF
Your browser does the conversion:
- Click View, then Open in new tab.
- Open the print dialog (Ctrl+P on Windows, Cmd+P on a Mac).
- Choose Save as PDF and save.
What is in a report
A report opens with its title and a Reporting Period line. Each ad platform then gets its own part:
- the month's headline cards (below);
- Month Over Month Comparison: the same figures against the previous month;
- Campaign Type Breakdown: the figures by campaign type;
- Invalid Traffic Types - {Platform}: the reasons Tapper flagged traffic. A visitor flagged for several reasons appears once per reason, so these add up to more than the blocked total. See Block reasons explained.
Figures are never added up across platforms.
The cards
| Card | What it tells you |
|---|---|
| Total Spend | Ad spend for the month on that platform. |
| Total Clicks | The clicks Tapper tracked and assessed for the month, the same count as the dashboard's Total Clicks. |
| Blocked Clicks | The invalid clicks Tapper flagged on that platform: every click of a flagged visitor on your connected ad accounts. |
| IVT Rate | Invalid clicks divided by the clicks on your connected ad accounts, like the dashboard's Invalid Traffic % (IVT stands for invalid traffic). |
| Reallocated Spend | The report's name for the dashboard's Reallocated Spend tile: each invalid click priced at its own ad account's CPC that day. See Reallocated spend: how your savings are estimated. |
| Conversions | Conversions as the ad platform reports them. |
| CPA | Spend divided by conversions. |
| Conversion Rate | The platform's reported conversions divided by the platform's own clicks. |
Which cards you see:
- Monitor-only workspaces see Wasted Clicks instead of Blocked Clicks and Wasted Spend instead of Reallocated Spend: nothing was blocked, so the report shows what invalid traffic cost. See Monitor-only.
- Conversions, CPA and Conversion Rate appear only when Tapper has verified conversion data for the month. Without them the report is still complete.
- A platform with no Tapper-tracked clicks that month gets no Total Clicks, Blocked Clicks, IVT Rate or Reallocated Spend card, rather than zeros.
Amounts are in US dollars, as on the dashboard, with each ad account's spend converted at the monthly exchange rate. Each month uses that month's rate, or the closest month's rate when a currency has none for it. An account with no currency on record, or whose currency has no rate at all, is left out of the spend totals. Its invalid clicks still count in Reallocated Spend, priced at that platform's average cost per click that day from your other accounts; a day when no account on that platform has dollar spend adds nothing. A report set up in your ad accounts' billing currency shows that currency instead, and every amount carries its symbol or code.
The tile definitions are in How the dashboard metrics are calculated.
When a report is published
Early on the first day of the next month, for a month in which your ad accounts had spend. Its row appears on Reports a short while later. There is nothing to set up.
Who can see reports
Every role, Owner, Admin, Manager and Viewer, can view and download reports, on plans that include Tapper's paid analytics. See Roles: what owners, admins, managers and viewers can do.
Related
Was this helpful?
Still need help?
Chat with our team and mention this article.