

The Performance Max placement report
On this page
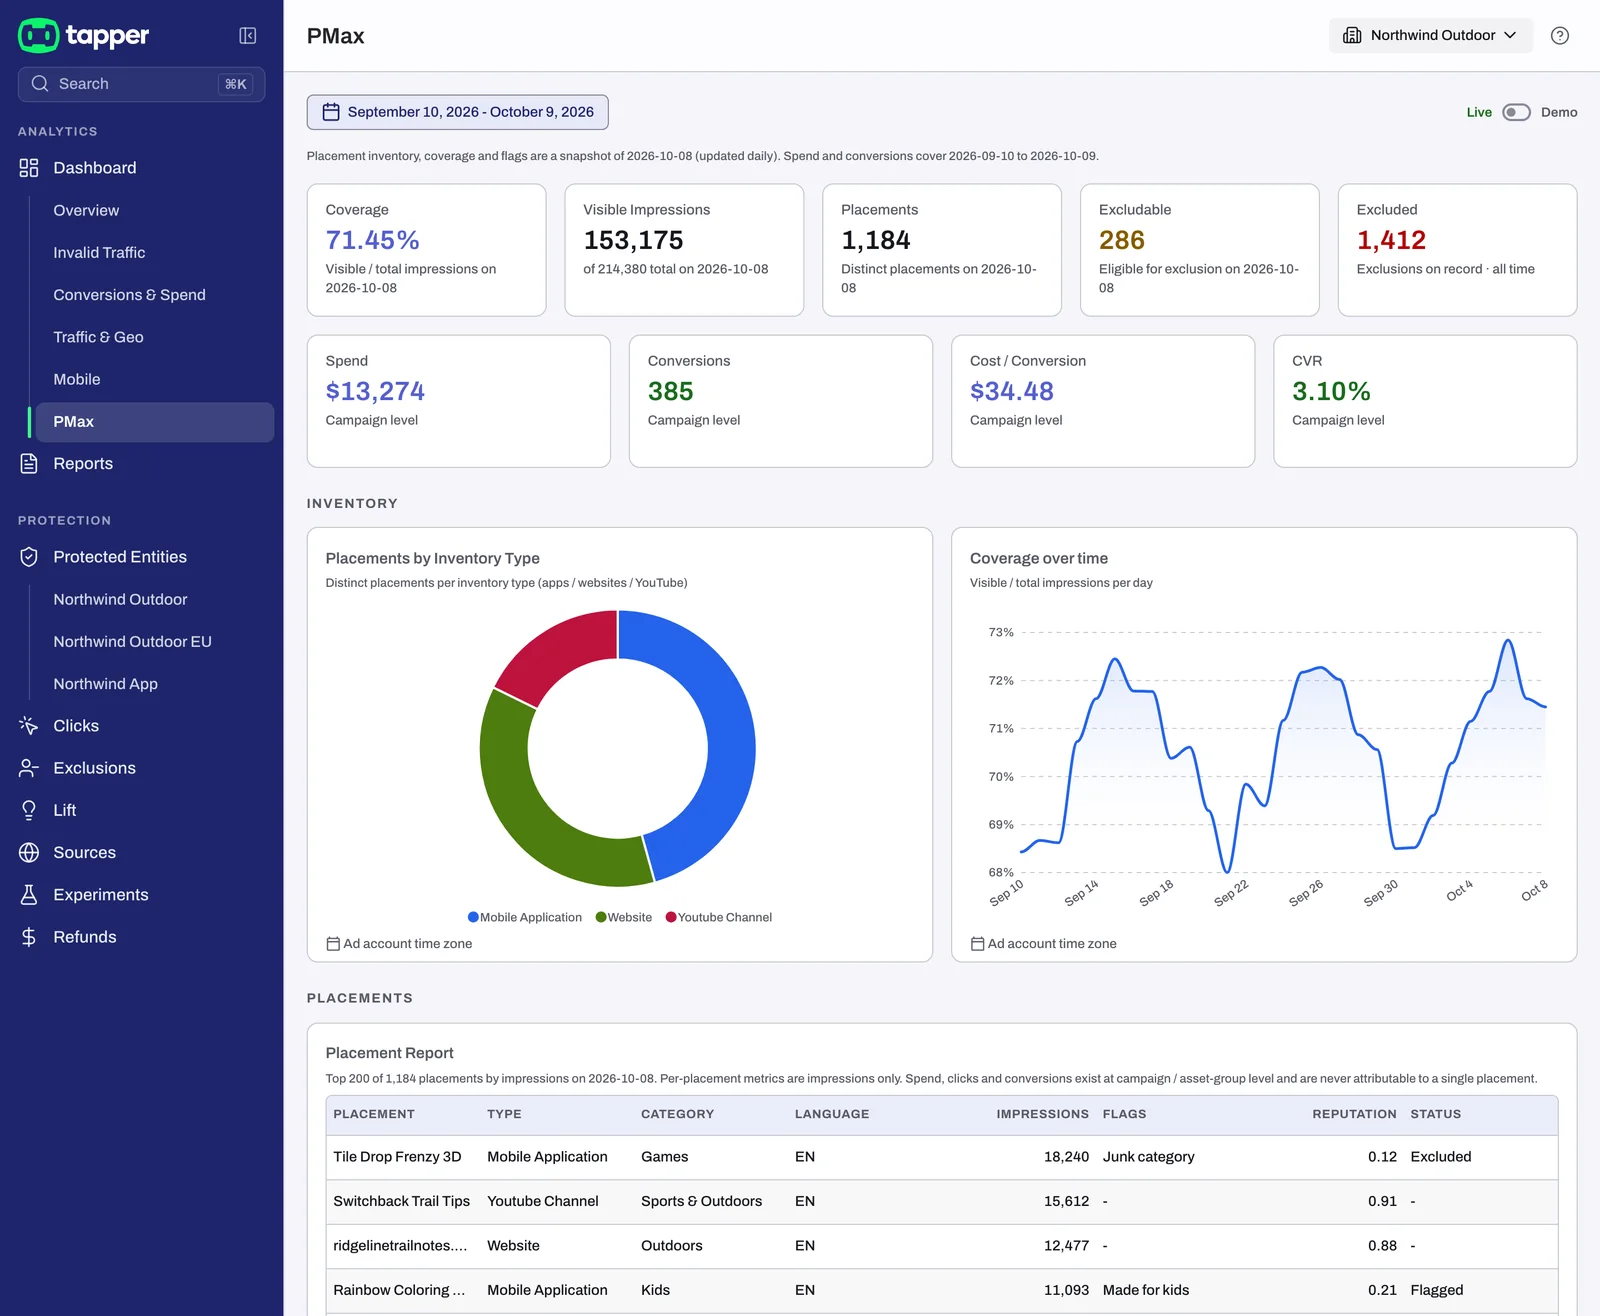
The Performance Max dashboard tab shows where your Performance Max ads serve: the apps, websites and YouTube channels that carried your impressions, which placements Tapper flagged, and which it excluded. Google reports no per-placement spend, clicks or conversions, so the tab keeps placement figures (impressions only) apart from campaign figures (spend, conversions, cost per conversion).
Before you start
- Open Dashboard in the sidebar's Analytics section and choose Performance Max.
- The tab is on every workspace with Block. Lift only workspaces have a single Lift dashboard with no tabs.
- It fills in once a connected Google Ads account has Performance Max campaigns delivering in the selected range.
- Only the date filter applies. Performance Max is a Google Ads campaign type, so Marketing platform and the other filters are not offered.
How it works
Google discloses Performance Max placements for website, app and YouTube inventory only; Search, Maps, Gmail and other networks have none. Coverage is visible impressions divided by total impressions, the share of your delivery that landed on a disclosed placement. Below 60% coverage, the report is not representative, so Tapper withholds it.
Each card names its window:
- Placement inventory, coverage and flags are a snapshot of the newest report day in your range, refreshed daily.
- Spend, conversions and exclusions removed are sums over your dates. Excluded alone ignores the date filter: it counts placement exclusions on record, all time.
Dates follow the Google Ads account's own day. Tapper Block writes the placement exclusions to your Google Ads account at account level; there is no switch for it in Setup. See Placement exclusions on Display and Performance Max.
KPIs
| Tile | Sub-line | Window |
|---|---|---|
| Coverage | "Visible / total impressions on {date}" | snapshot day |
| Visible Impressions | "of {N} total on {date}" | snapshot day |
| Placements | "Distinct placements on {date}" | snapshot day |
| Excludable | "Eligible for exclusion on {date}" | snapshot day |
| Excluded | "Exclusions on record · all time" | all time |
| Spend | "Campaign level" | selected range |
| Conversions | "Campaign level" | selected range |
| Cost / Conversion | "Campaign level" | selected range |
| CVR | "Campaign level" | selected range |
"Campaign level" means the figure exists for the campaign (at finest, the asset group), never for one placement. A figure Tapper could not read shows "-", not zero. When the placement model has no rows for your range, Visible Impressions reads "Placement inventory unavailable for this range".
Inventory
- Placements by Inventory Type: distinct placements per inventory type (apps, websites, YouTube) on the snapshot day.
- Coverage over time: "Visible / total impressions per day". Days on which Google reported more visible than total impressions are left out, and the caption says how many.
Placements
The Placement Report lists the largest placements by impressions on the snapshot day. Its caption gives how many of that day's placements are shown and the rule: "Per-placement metrics are impressions only. Spend, clicks and conversions exist at campaign / asset-group level and are never attributable to a single placement."
| Column | What it holds |
|---|---|
| Placement | the app, site or channel name, or its identifier |
| Type | the inventory type |
| Category | the content category, or "-" |
| Language | the language code, or "-" |
| Impressions | impressions on the snapshot day |
| Flags | Junk category, Made for kids, Off language, Off context, Age restricted, or "-" |
| Reputation | Tapper's reputation score, to two decimals |
| Status | "Excluded" once Tapper has excluded it, "Flagged" when it carries a flag, otherwise "-" |
Cleanup
- Caught: "Placements flagged on {date}" (snapshot day).
- Excludable: "Of caught, eligible for exclusion on {date}" (snapshot day).
- Removed: "Exclusions applied {from} to {to}" (selected range). Narrowing the dates moves this tile; the other two stay put.
Cost by Asset Group lists Asset Group, Cost, Conversions and CPA. Its caption says whether it covers every asset group or the top ones by cost, which dates it spans, and that "Figures are in the ad account's own currency, not converted." The Spend tile is converted, so the two can differ.
When the report is withheld
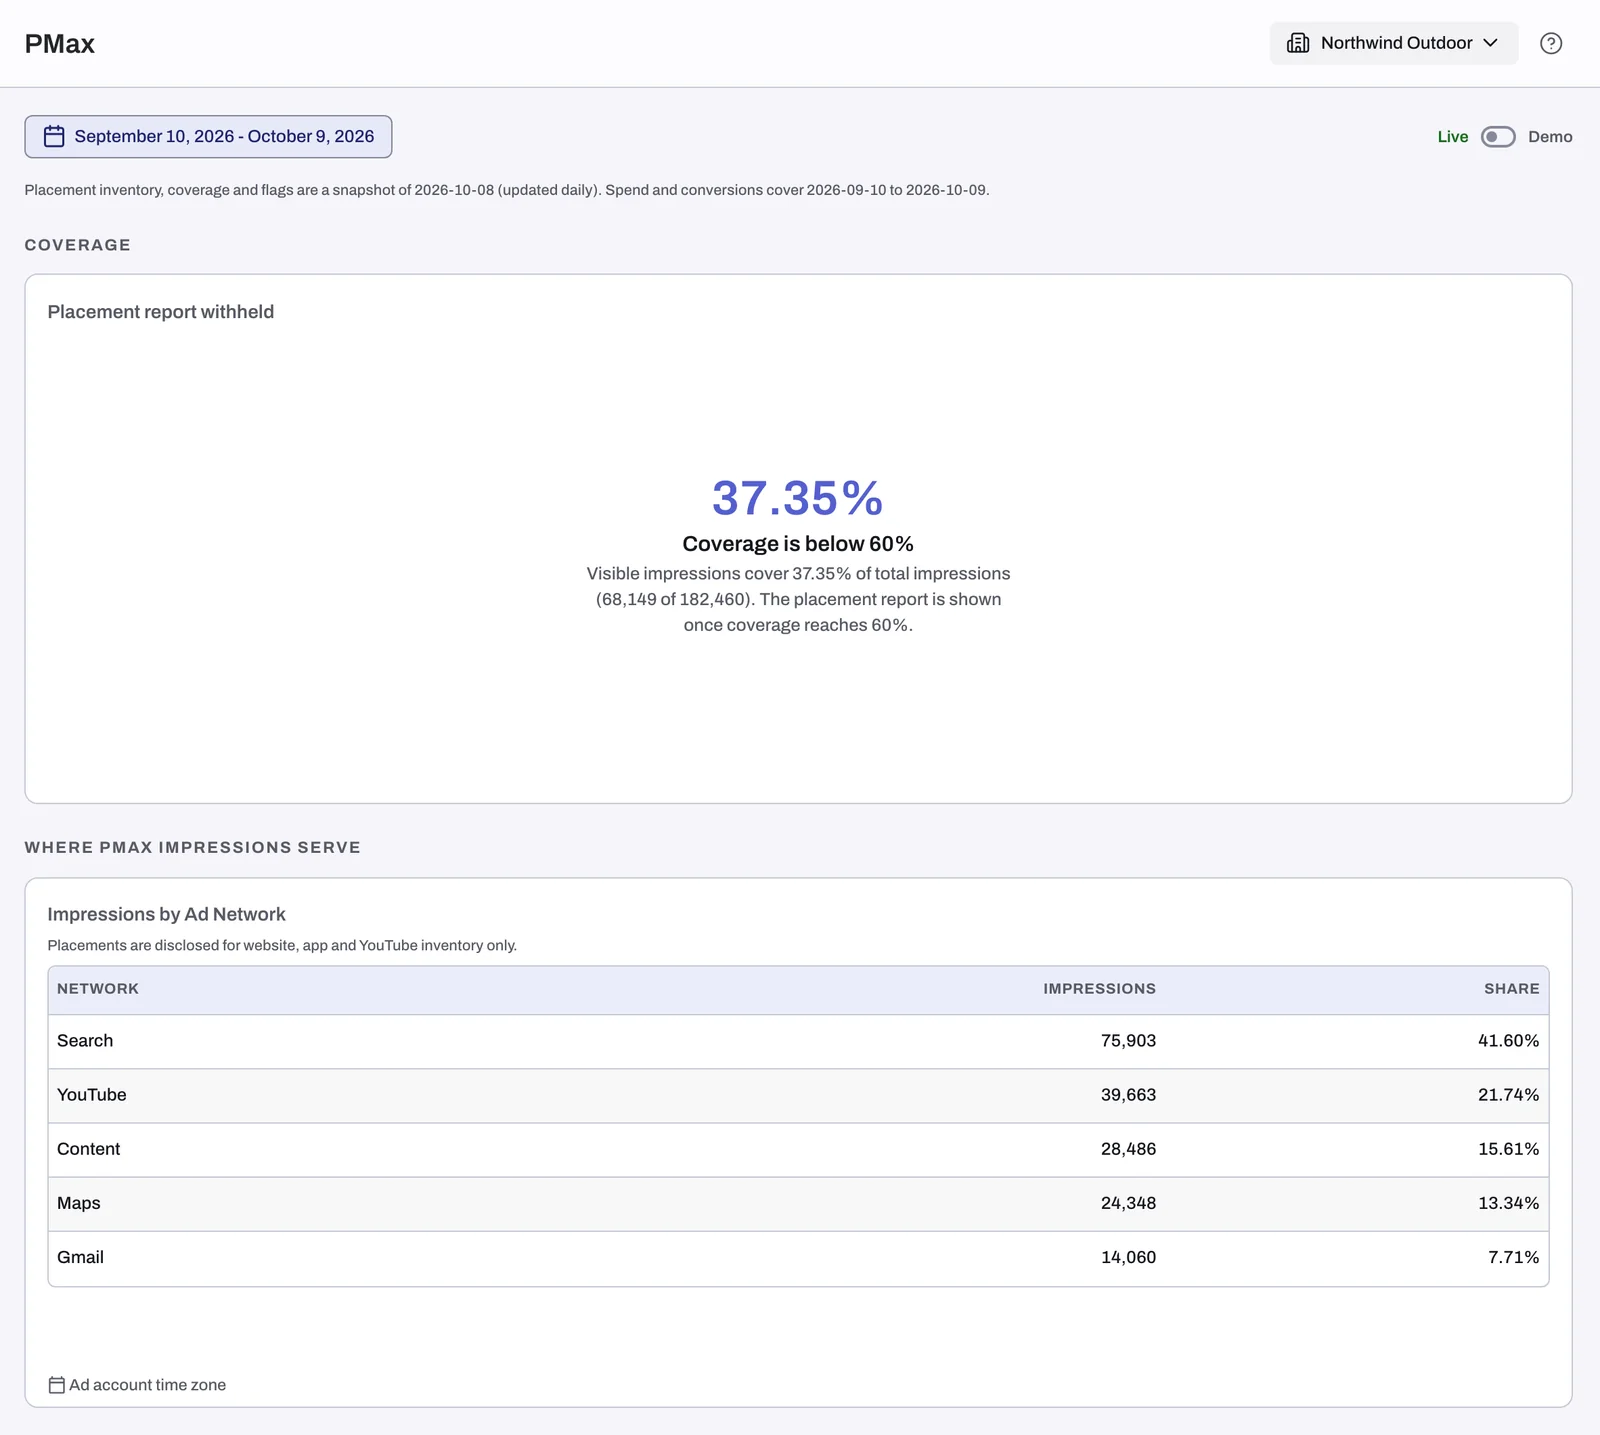
Below 60% coverage on the snapshot day, the report is replaced by one Coverage card, Placement report withheld, with the coverage figure. It returns once coverage reaches 60%.
Below it, Where PMax Impressions Serve gives Impressions by Ad Network (Network, Impressions, Share), captioned "Placements are disclosed for website, app and YouTube inventory only." When most delivery is on Search, Maps or Gmail, there are no placements to report. Coverage rises as more impressions serve on app, website and YouTube inventory.
Empty state and demo data
| Situation | The tab shows |
|---|---|
| No Performance Max data in the range | No Performance Max data in this range: pick another range or clear the filters |
| Google Ads connected, no Performance Max campaign delivering | No Performance Max campaigns |
| No Google Ads account connected | No Performance Max data; Connect Google Ads opens the list of protected entities |
Show demo data switches the dashboard to an example report under the Demo data banner; Turn off demo data returns to your own data. See Demo data: look around before your own data arrives.
Related
- The Exclusions page and the exclusion details: the Placements view lists each excluded placement with its score and date.
- The Conversions and Geography tabs: the Placement exclusions card on Geography.
Was this helpful?
Still need help?
Chat with our team and mention this article.