

The Results page: spend and campaign performance
On this page
Lift's Results page shows where your ad money went and what it brought back, for the dates you pick: spend by platform and campaign type, share of spend against share of conversions, and campaign tables for Google Ads and Meta. Fixes are on the second tab: Automatic fixes and the Activity tab.
Where to find it
Under Lift in the sidebar, select Results. The page is headed Lift, "How your ad accounts perform, and what the changes you applied did.", with tabs Results and Activity.
- For Owners, Admins and Managers. A Viewer can open it, but figures do not load and Export PDF is hidden (roles).
- Spend figures and the Google Ads and Meta tables cover every ad account in the workspace, whichever entity the switcher shows.
- A white-label partner app has no Export CSV, Export PDF or Adjust card.
Top to bottom: the Adjust card (when it applies), the filter row, Spend, Why behind the spend, Google Ads and Meta.
Dates and Platform
- Dates. It opens on the last 30 full days, ending yesterday; today is never counted. Quick ranges: Yesterday, Last 7 days, Last 30 days, Last 90 days, Previous month, Last 12 months and Last quarter, each ending yesterday, or pick days on the calendar and press Apply. Your dates hold while you stay; coming back resets to 30 days.
- Platform. Picks Google Ads, Meta, TikTok or Microsoft Ads; empty means every platform. A name in Spend by platform picks it too. Clear the chip or press Clear to reset.
Google Ads shows only while the chip is empty or on Google Ads. The Meta panels follow your dates but not the chip.
Export CSV and Export PDF
Export CSV downloads the spend behind the page, for your dates and platform, as one file, such as "spend-google-ads-2026-09-21-to-2026-10-20.csv". It is off until figures load, and when nothing was spent in your dates or the same number of days before. It holds spend and results only, not the Lift report.
| Column | What it holds |
|---|---|
| Level | Total, Platform, Ad account, Campaign type, Top campaign or Day. Filter on Platform, Ad account, Campaign type or Day, and its rows in one currency add up to that currency's Total row. |
| From, To | Your dates. |
| Day | The day, on Day rows. |
| Platform, Ad account, Campaign type, Campaign | Where the row belongs, where the level has it. |
| Currency | The ad account's own currency. Each row is in one currency, and the Total level has one row per currency. |
| Spend, Spend (USD) | Spend in that currency, and in US dollars (empty when there is no exchange rate). |
| Previous spend, Previous spend (USD) | Spend in the same number of days just before your dates. |
| Change | The change the page shows, such as "+12%"; "no earlier data" when the data starts inside the earlier days; empty when nothing was spent then. |
| Conversions, Conversion value, Cost per conversion, ROAS | The platform's results, on the rows that have them. |
Amounts are exact, with no currency sign or thousands separator, so rows add up to the cent. Top campaign rows are up to ten per platform and currency.
Export PDF opens Export Lift report on your dates, with the picked platform's accounts (all when none is picked). On the default 30 days it opens on Custom with those days, because its own Last 30 days ends today. When accounts sit on several entities, the PDF covers the whole workspace, and the dialog says, for example, "Every Meta Ads account on the workspace (3)". See Export a Lift report as PDF.
Export PDF is hidden for a Viewer, and while full recommendations wait for your agreement to start. When off, the reason shows under the filter row:
| Message | Why |
|---|---|
| "Available once a Google Ads, Meta Ads or TikTok Ads account is connected." | The report covers those platforms, and none is connected. |
| "No Meta account to put in the PDF." (or Google Ads, TikTok) | The picked platform has no account for the report. |
| "Lift does not review Microsoft Ads, so there is no Microsoft Ads PDF. Its spend is in the All platforms PDF." | You picked Microsoft Ads. Clear the chip for the all-platforms PDF. |
The Adjust card
When the entity spent on Google Ads or Meta app campaigns in the last 30 full days and no Adjust app is connected, the page opens with Check your app campaigns against Adjust: "Connect Adjust so Lift can check Google's and Meta's numbers against your own Adjust numbers. Lift only reads campaign totals once a day and never changes anything in Adjust."
Set up Adjust opens Setup > Mobile app on a new app, or, if an app's last check failed, on that app to fix its keys. The card leaves once an app is connected, or while Tapper confirms it. TikTok app campaigns do not bring it up. See Connect a mobile app through your tracking tool.
Spend
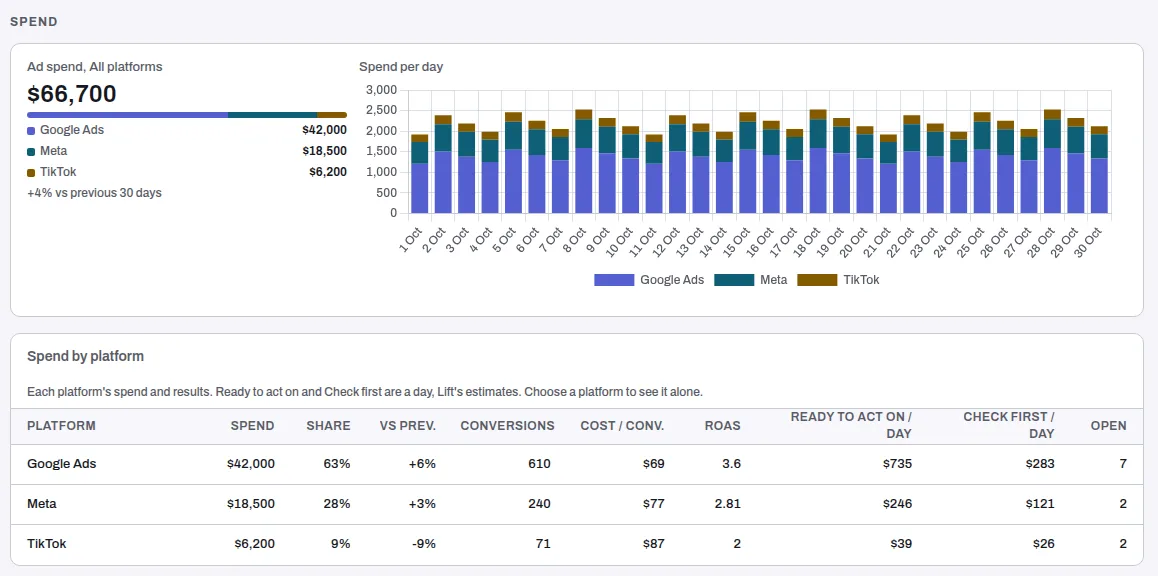
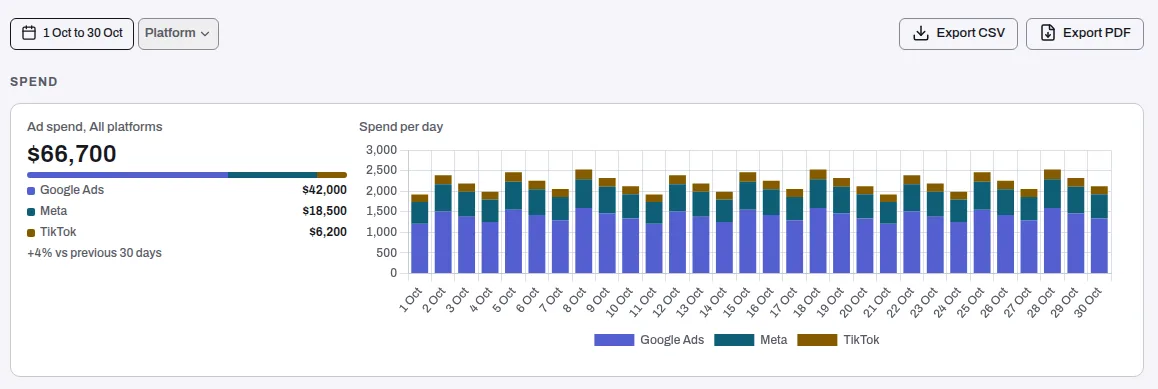
Ad spend, All platforms (or the picked platform) is the total for your dates, with its change on the same number of days before, such as "+12% vs previous 30 days". Spend per day stacks each day by platform. With every platform shown, a bar splits the total by platform.
The change can also read "No earlier data for the previous 30 days" (an account's data starts inside those days; not a fall) or "No spend in the previous 30 days to compare with".
Currencies are never added. With several, a Currency switch picks one, most spend first.
Spend by platform
With every platform shown, one row per platform, most spend first.
| Column | What it shows |
|---|---|
| Platform | The platform. Press its name to see it alone. |
| Spend | Its spend in your dates. |
| Share | Its share of the total in this currency. |
| vs prev. | Change on the days before, such as "+12%". "no earlier data" when its data starts inside those days; "-" when it spent nothing then. |
| Conversions | The conversions it reports. |
| Cost / conv. | Spend per conversion. |
| ROAS | Return on ad spend. |
| Ready to act on / day | Money a day on its open recommendations that Lift is confident in. |
| Check first / day | Money a day Lift found whose figure rests on a judgement: look before you act. |
| Open | Its open recommendations. |
The last three columns are today's recommendations, whatever your dates. The two money columns together are Lift's savings estimate: see Impact.
One platform
With a platform picked, two tables follow.
Spend by campaign type: Campaign type, Spend, Share and vs prev. App campaigns are their own row; untyped campaigns read "No type".
Top campaigns by spend: the platform's ten biggest campaigns across its accounts (or every campaign that spent, with fewer), with Campaign, Campaign type, Spend, Share of spend, Share of conversions, Conversions and Cost per conversion. Shares are of that platform; Cost per conversion reads "None" for spend with no conversions.
When there is no spend
| Message | What it means |
|---|---|
| No spend data to show | "Your connected ad accounts have not sent any spend data. It shows here as soon as they do." |
| No spend in this range, with a platform picked | "Google Ads has no spend in this range. Choose another platform or other dates above." (with the platform you picked) |
| No spend in this range, on dates you picked | "No ad account spent anything on these dates. Go back to the last 30 days to see the latest spend." Show the last 30 days takes you back. |
| No spend in this range, on the default dates | "Spend and results show here once a connected ad account has spent." |
Why behind the spend
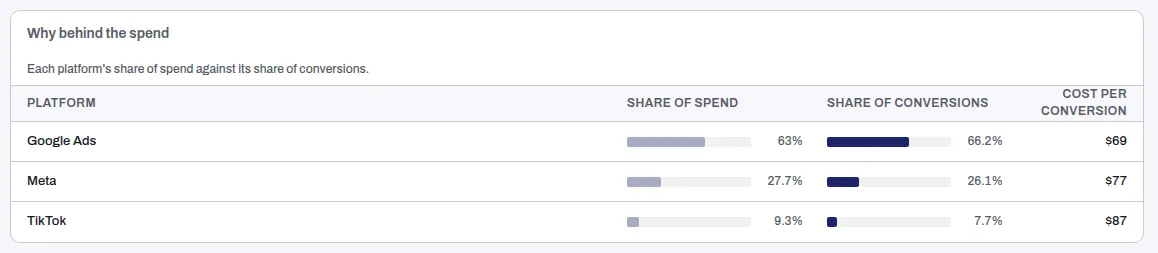
Same dates and platform; one row per platform, or per campaign type with a platform picked. Left out when nothing was spent.
| Column | What it shows |
|---|---|
| Platform (or Campaign type) | Most spend first. A name in two currencies carries its currency, such as "Google Ads (AED)". |
| Share of spend | A pale bar on a 0 to 100% track, with the figure. |
| Share of conversions | A solid bar, with the figure. |
| Cost per conversion | Spend per conversion, or "None". |
The line under the title names the largest gap, when one line takes at least 10% of spend and at least 10 points more of spend than of conversions, such as "Google Ads took 62% of spend and 31% of conversions." or "Performance max took 48% of Google Ads spend and 20% of its conversions." Otherwise it says what the bars compare. A currency without a rate adds "No exchange rate for" that currency, "so no platform has a share of spend."
Google Ads
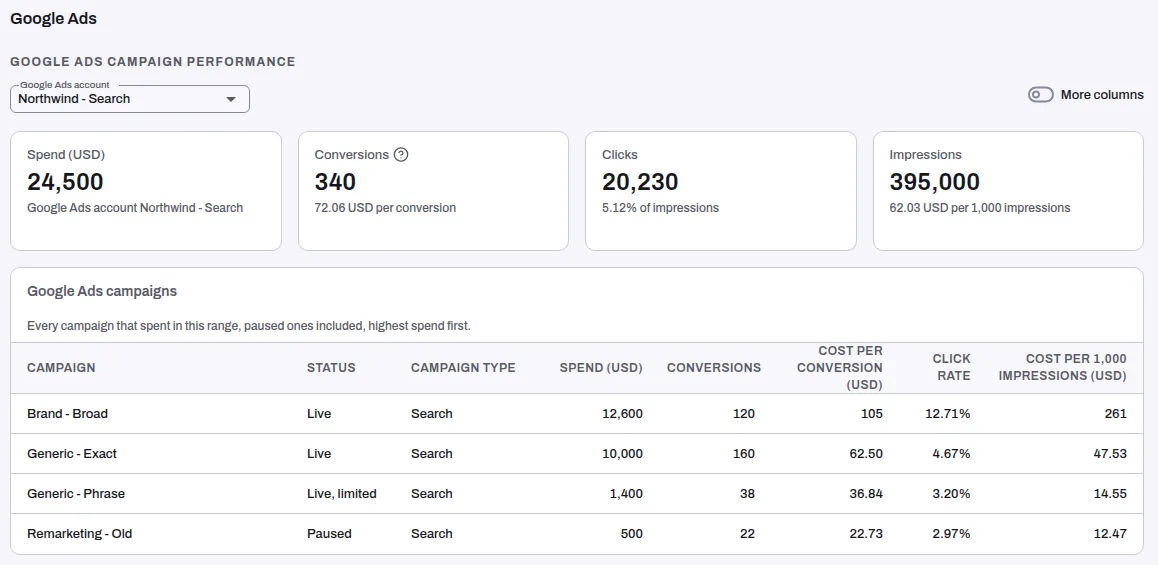
Google Ads campaign performance lists every campaign of one Google Ads account that spent in your dates, paused ones included, most spend first. It shows when the chip is empty or on Google Ads, a Google Ads account exists, and it spent in your dates.
- Google Ads account: pick one; it opens on the first.
- More columns adds Impressions, Clicks and, where reported, Conversion value.
- The currency switch offers the account's currency and USD when it does not spend in dollars. Money columns name their currency, such as Spend (AED).
| Tile | What it shows |
|---|---|
| Spend | The account's spend, with its name. |
| Conversions | Google's count, with cost per conversion. Its ?: "Google's count of the account's primary conversion actions, as the account reports them. Data-driven attribution can split one conversion across campaigns." |
| Clicks | Clicks, with the click rate "of impressions". |
| Impressions | Impressions, with cost per 1,000 impressions. |
Google Ads campaigns has Campaign, Status (Live, Paused, Ended or Live, limited), Campaign type, Spend, Conversions, Cost per conversion, Click rate and Cost per 1,000 impressions. Empty: "No campaign spent in this range."
Meta
Shown when the workspace has a Meta account. Three panels read one Meta account at a time: pick it in Meta account on the first panel, and all three follow.
With a store connected, each panel's notes open with "Meta says: every figure here is Meta's own count, not your store's." Purchases, purchase value and return carry "Meta says", such as Purchases (Meta says). Money figures name the currency, such as Spend (USD); below they are written without it.
Meta campaign performance
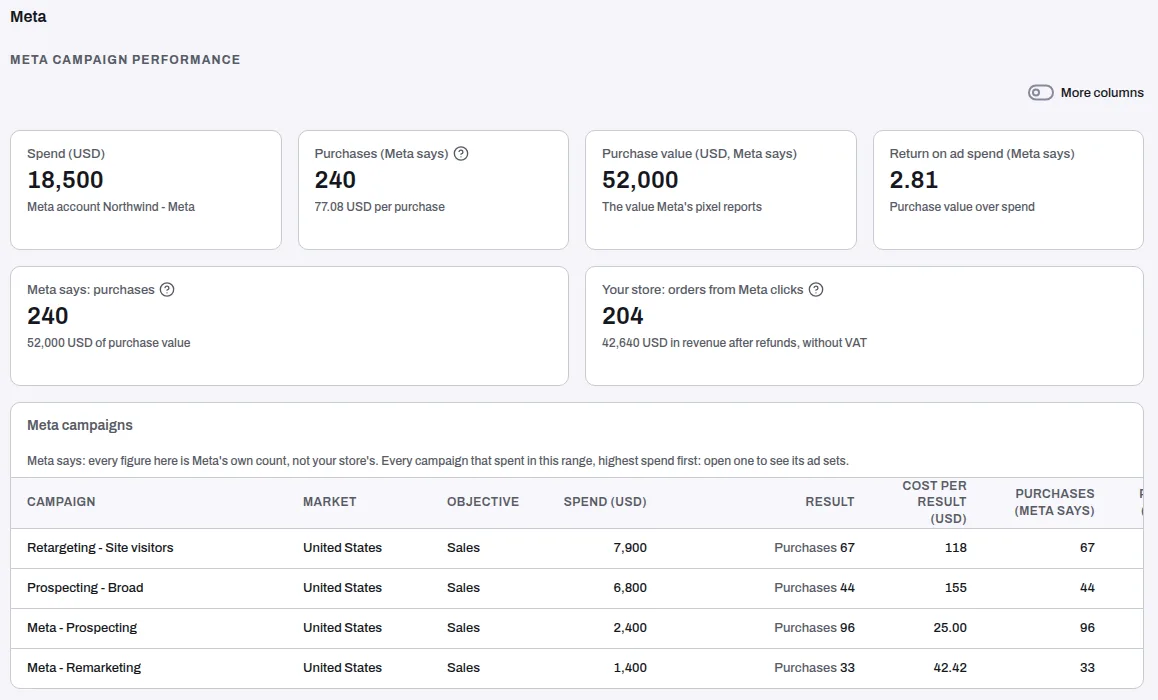
Every campaign that spent in your dates, most spend first.
- Market picks markets when campaigns run in more than one; worldwide reads "Global". A multi-market campaign shows only with no market picked.
- Objective picks objectives when the account spends on two or more: Sales, Leads, App, Traffic, Awareness, Engagement or Other. Tiles keep the account's (or one market's) figures.
- More columns and the currency switch work as on Google Ads.
Tiles: Spend, then up to three top objectives:
| Objective | Its tiles |
|---|---|
| Sales | Purchases (Meta says), Purchase value (Meta says) and Return on ad spend (Meta says) |
| Leads | Leads and Leads on lead-goal ad sets |
| App | Installs |
| Traffic | Landing page views |
| Awareness | Impressions |
| Engagement | Messaging conversations |
An objective with no figure has no tiles, and a line says so, such as "Purchase figures are not available for these campaigns in this range." A second row can add Your store: orders from Meta clicks (test and cancelled orders left out) beside Meta says: purchases, both account-wide, and ThruPlays.
Meta campaigns: press a campaign for Meta ad sets, an ad set for Meta ads. The trail from All campaigns goes back up.
| Column | What it shows |
|---|---|
| Campaign (Ad set, Ad) | The name. Press it to open the level below. |
| Market | Where it runs. |
| Objective | Its objective. |
| Spend | Its spend. |
| Result | Its own result, named, with its count. Mixed means its ad sets count different results, never added: open it to see each. |
| Cost per result | Spend per result. |
| Purchases (Meta says), Purchase value (Meta says) | Shown when a row has them. |
| Return on ad spend (Meta says) | Shown when a sales row is listed; other rows read "-". |
| Reach | Meta's people reached, when sent. |
| Click rate, Cost per 1,000 impressions | Clicks over impressions, and spend per 1,000 impressions. |
More columns adds Link clicks, Cost per link click, Landing page views, Adds to cart, Checkouts, Registrations, 3 second video plays, ThruPlays and Cost per ThruPlay (where a row has them), Frequency and Cost per 1,000 reached (with reach), Impressions, Clicks, Link click rate, Leads, Cost per lead, Leads on lead-goal ad sets and Cost per lead on lead-goal ad sets (left out when they repeat Leads on every row), and Cost per purchase.
Reach for new dates takes about a minute: "Meta's reach for these dates shows here in about a minute." The page rechecks on its own for about five minutes.
Meta placements, age and gender
Each placement's, or age and gender's, share of spend against its share of leads, one scope at a time.
- Placement and Age and gender switch the breakdown.
- Scope picks a market, campaign or ad set. Markets are never added.
- Leads (Meta's lead action, instant forms and website) and Results (each ad set's own result) switch the count. Results is off when a scope's ad sets count different results.
Columns: Placement (or Age and gender), Spend, Spend share, Leads (or Results), Lead share (or Result share), Cost per lead (or Cost per result) and 95% range (where the cost likely falls). Rows with too little to read are greyed.
A scope whose ad sets all count purchases shows Purchases (Meta says), Purchase share, Purchase value (Meta says), Value share, Return on ad spend (Meta says) and Cost per purchase, with no switch.
- Show details opens the notes, including "Nothing here is called waste until qualified leads or sales come back from your CRM, and no age or gender change is suggested."
- A scope with a housing special ad category campaign has no age and gender split; the table says why.
- At most 92 days: "This panel reads at most 92 days. Pick a shorter range to see it."
- A missing breakdown says so, such as "Meta did not return this breakdown for the range, so it is not known (not zero)."
- Days are Meta's, in the ad account's time zone (Ad account time zone footer).
Meta results by audience type
One table per goal, titled with its spend and counts. Rows are audience types: Advantage+ audience, Retargeting, Customer list, Lookalike, Interests, Broad or Custom audience, kind not known. "Each ad set counts once a day, under the warmest audience it targets." Exclusions never set the type.
- Columns: Audience type, Ad sets, Spend, Spend share, Leads (or Results) and Cost per lead (or Cost per result), with the same switch.
- A purchase goal shows Purchases (Meta says), Purchase share, Purchase value (Meta says), Value share, Return on ad spend (Meta says) and Cost per purchase, greyed under 10 purchases. Leads are never added to purchases.
- Spend on days with no targeting snapshot has no type: a line starts "Not classified:" with that spend.
- Figures start on 8 Oct 2026, the first day of targeting history. Earlier start dates show a Since chip; dates ending earlier show a sentence instead of figures.
- At most 92 days, as above.
Reading the tables
- 8 rows a page, with a pager. A wide table scrolls sideways inside its card.
- A dash (-) means not known, never zero.
- Each money column names its currency once, in its heading.
Related
Was this helpful?
Still need help?
Chat with our team and mention this article.